- 0xResearch
- Posts
- sUSDe Hyperfixation
sUSDe Hyperfixation
Forecasting market regimes with yield curves
Carlos & Luke Leasure
January 27, 2026

Hi all, happy Tuesday!
Crypto started the week on firmer footing after the Sunday night selloff.
In today’s note, we unpack the renewed outperformance of HYPE and PUMP. Most importantly, we introduce a framework for forecasting market regimes using the sUSDe term structure on Pendle.
Crypto markets started the week on a firmer footing following Sunday’s selloff. BTC closed Monday at ~$88,300 (+2.0%), outperforming US equities and gold. Gold finished roughly flat but remains above $5,000/oz, while the S&P 500 (+0.9%) and Nasdaq 100 (+1.2%) also advanced ahead of the Jan. 27-28 FOMC meeting.

Markets are overwhelmingly positioned for the Fed to hold rates steady on Wednesday, with Polymarket implying a rough 99% chance of no change; Fed funds futures show similar confidence in that outcome. That said, the meeting is likely to be overshadowed by renewed questions about the Fed’s independence after the Justice Department’s probe involving Chair Jerome Powell, with Trump signaling he could name a successor soon. Of note: Powell’s term as chair ends in May 2026.

Regarding cross-index performance, Perps (+12.1%) was the top-performing index by a wide margin, followed by DeFi (+6.4%) and AI (+4.6%). Within Perps, HYPE led the cohort, rising +12.2% on the day.

— Carlos

HYPE (+12%) and PUMP (+10%) were among Monday’s standout gainers, leading the rebound and outperforming the majors (BTC, ETH, SOL). Anecdotally, the last time both assets led the crypto market was in mid-September, a few weeks before the Oct. 10 liquidation cascade. What’s driving renewed relative strength in the cycle’s two darling apps?
Hyperliquid: HIP-3 traction is accelerating
Hyperliquid’s relative strength appears tied to a fresh leg of momentum in HIP-3 markets. Over the past several days, trading activity has picked up sharply, an encouraging signal that perps demand is expanding beyond crypto-native assets and into TradFi-linked markets (notably equities and metals).
The chart below shows HIP-3 daily volume over time. Led by TradeXYZ, HIP-3 volume hit an all-time high above $1.4B yesterday.

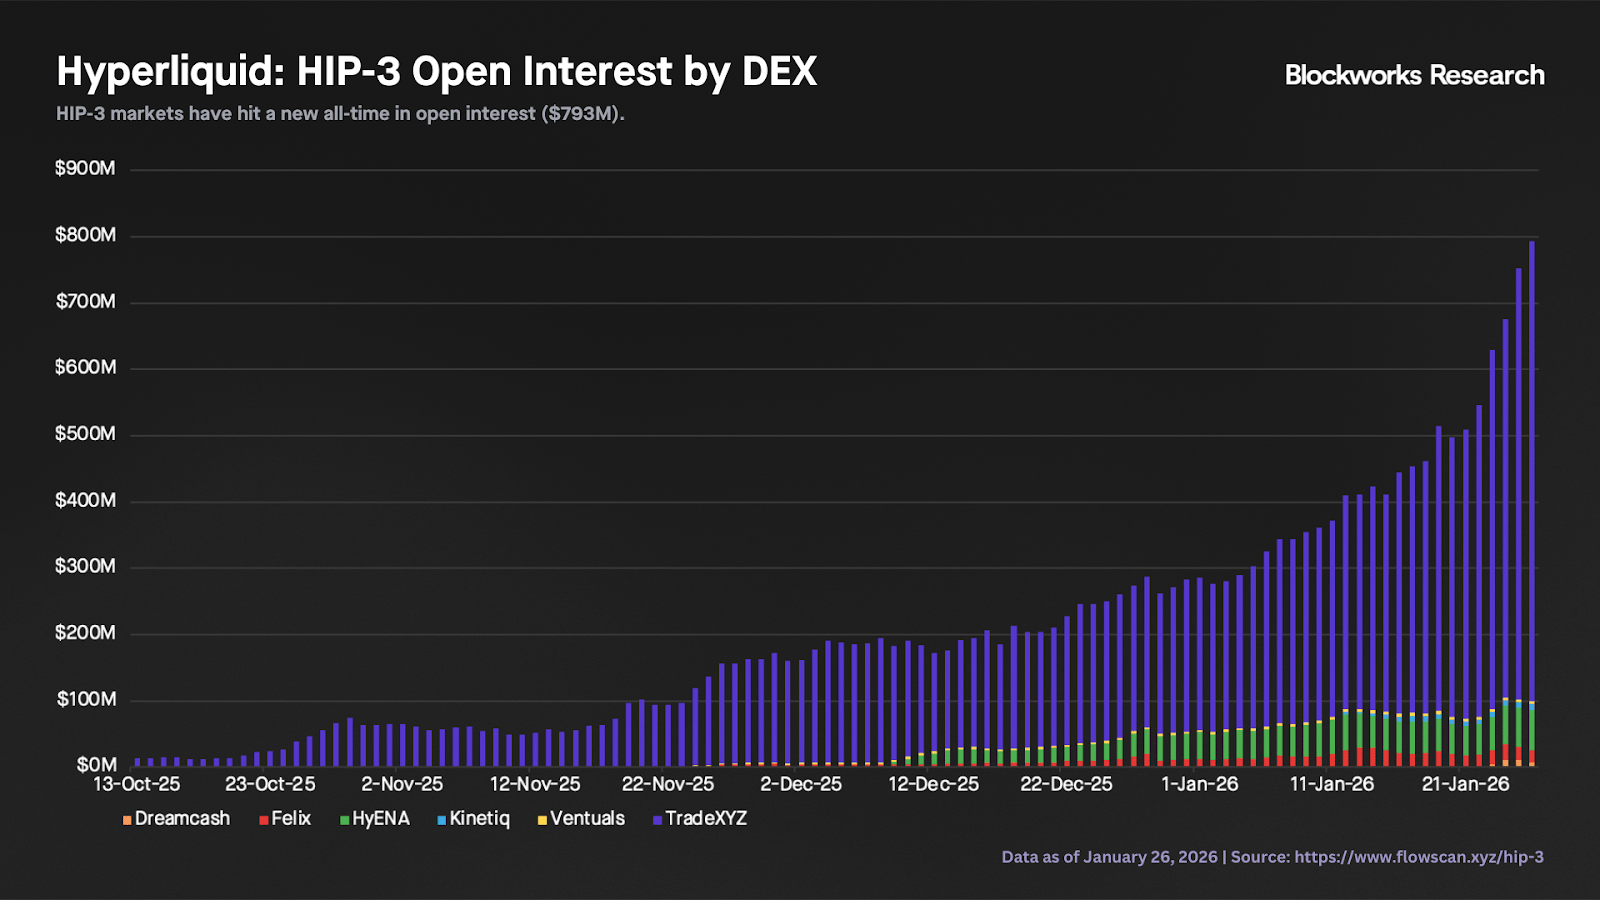
Open interest has also been grinding higher, reaching a new peak of $793M. TradeXYZ remains the clear leader with $693M in OI (87% share), followed by HyENA ($61M, 8%) and Felix ($19M, 2%).
The strong growth of HIP-3 markets matters even more in light of last week’s NYSE announcement around developing a tokenized securities platform aimed at enabling 24/7 trading, pending regulatory approval. If realized, this platform would be a structural catalyst for equity perps: Continuous spot pricing reduces weekend gap risk, pushing equity perps closer to the reliability profile of BTC and ETH perps.
Pump: The return of the trenches?
Pump, meanwhile, has rallied alongside an apparent “memecoin revival.” A handful of notable runners have made headlines over the past few days, most recently PENGUIN, which went from effectively zero to roughly $130M market cap within days. That sort of reflexive price action tends to attract new traders and can quickly recreate a more speculative onchain environment.
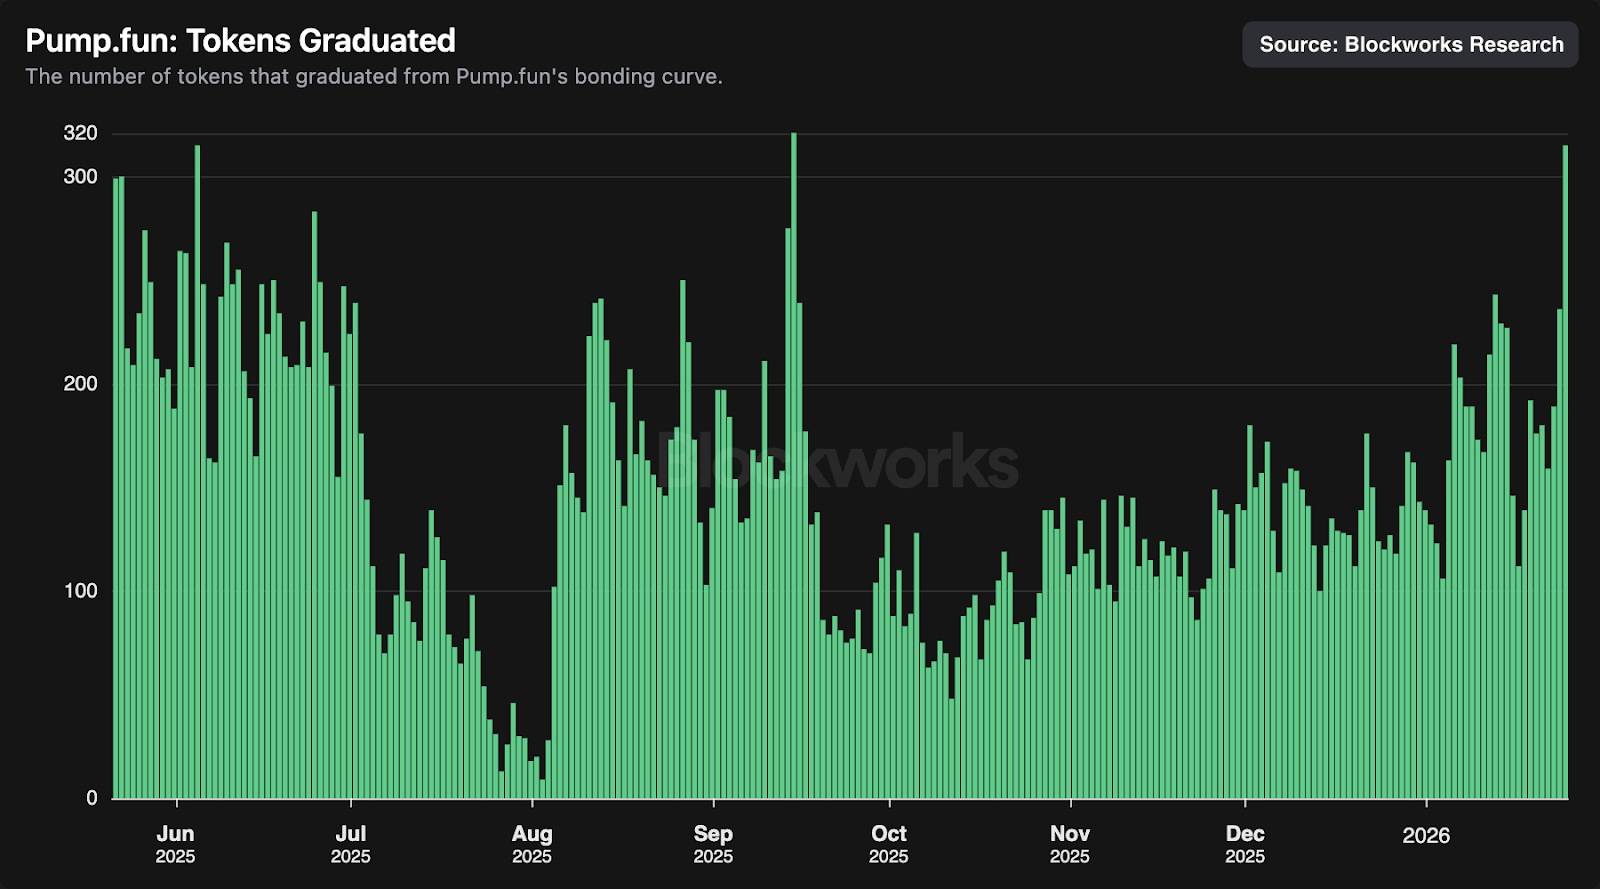
The chart below shows that Pump saw 315 tokens graduate on Jan. 25, the highest figure since Sep. 15, 2025.
Alongside the pickup in graduated tokens, revenue has begun to reaccelerate. On Sunday, Pump surpassed $2M in daily revenue for the first time since mid-September 2025. However, Pump’s revenue mix is much healthier today than it was back then. For the first time, AMM fees accounted for more than 30% of total revenue, while terminal revenue has remained steady at ~7%. This shift is underappreciated: Pump is no longer monetizing primarily at launch via the bonding-curve fee, but increasingly capturing value across the full token lifecycle, allowing it to benefit from runners like PENGUIN even after graduation.

As a final note, while the efficacy of buybacks has been hotly debated over the past few months, the reality is that both teams have consistently returned value to tokenholders: Hyperliquid has repurchased 13.11% of circulating HYPE, while Pump has bought back nearly 21% of PUMP’s circulating supply in a shorter timeframe.
As shown below, Hyperliquid and Pump remain at the top of the revenue leaderboard over the past seven days. If fundamentals continue to improve, we could expect continued outperformance.

— Carlos
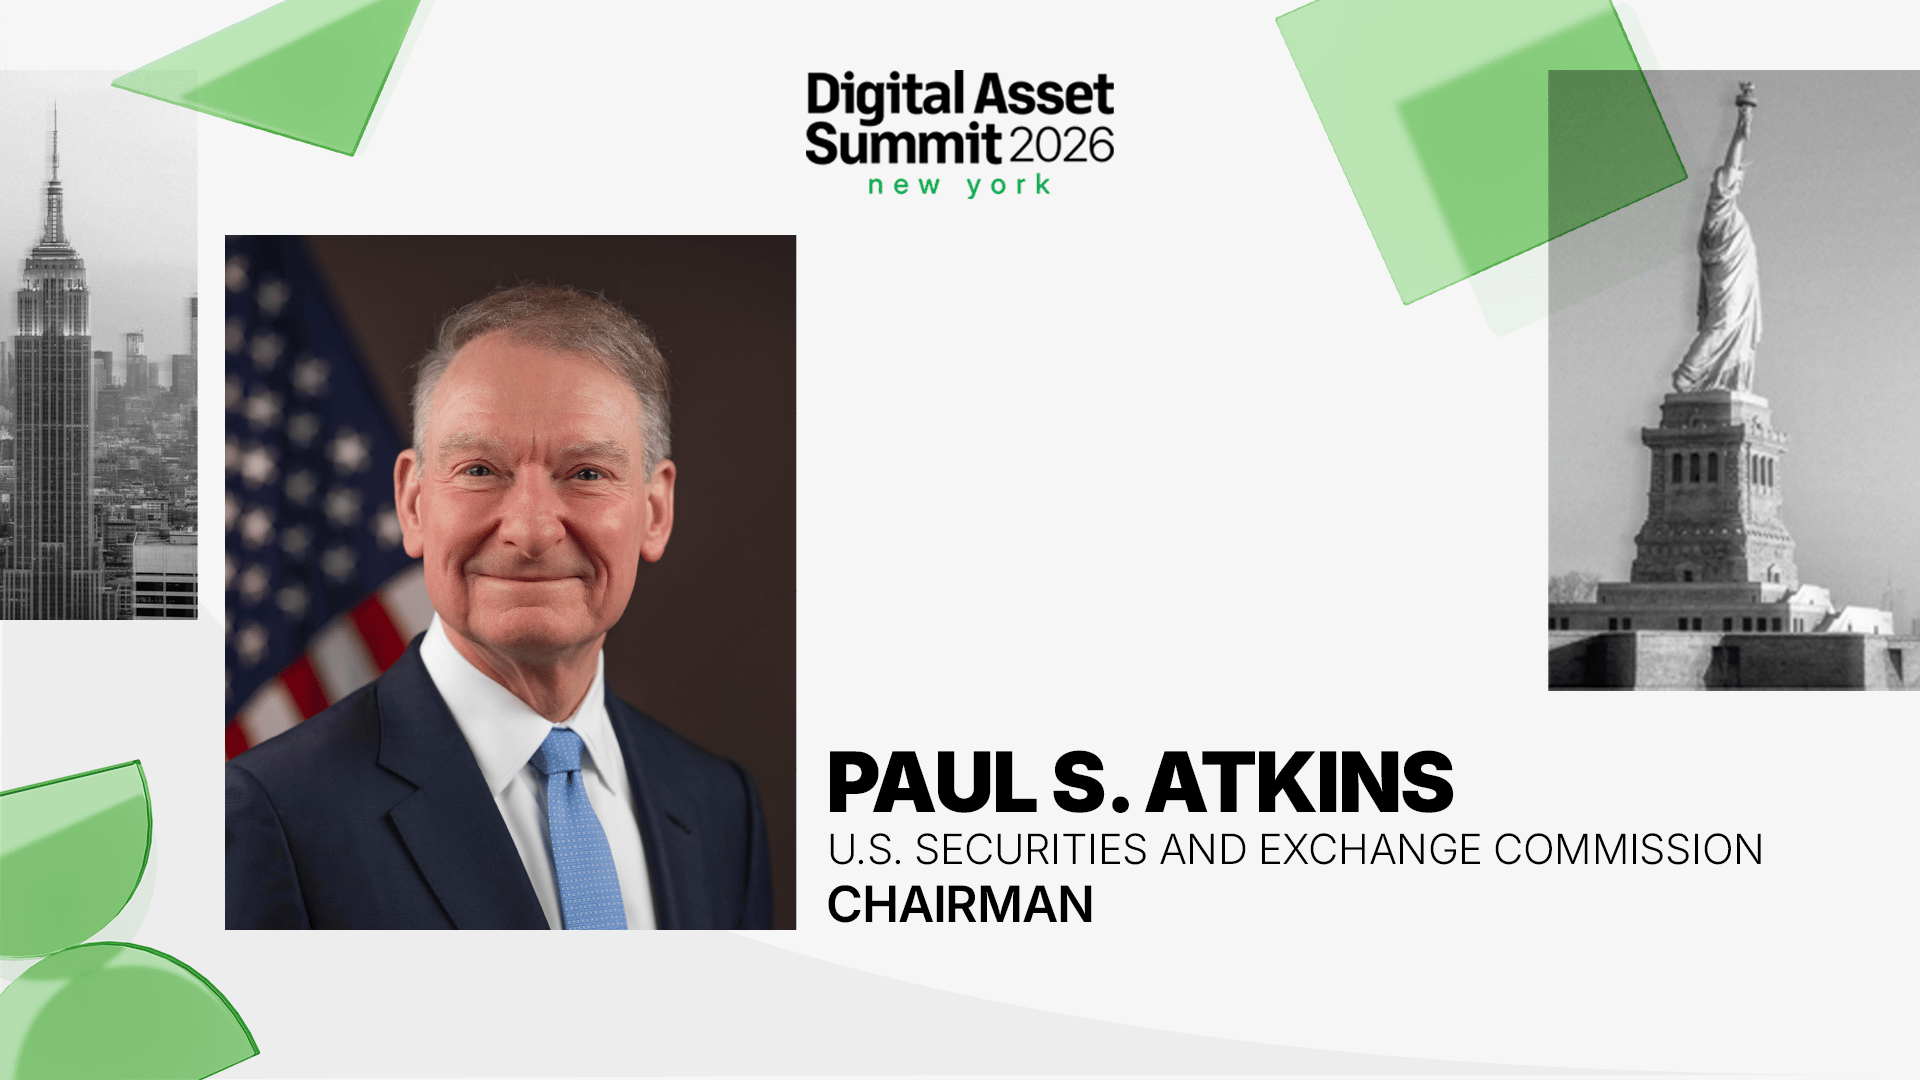
Crypto’s premier institutional conference is back this March 24–26 in NYC.
Don’t miss SEC Chairman Paul S. Atkins’ keynote on Day 1.
Forecasting market regimes with the sUSDe term structure
As crypto markets continue to mature into a more capital-efficient financial system, new onchain indicators are emerging that help characterize market sentiment and anticipate regime shifts. One such indicator is the sUSDe term structure on Pendle, which provides a forward-looking signal for funding rates, cost of carry, and downstream asset price behavior.
Funding rates, basis, and the emergence of a yield curve
Perpetual futures play a central role in crypto price discovery. Over the past year, BTC perpetual volume on major venues has exceeded spot volume by a multiple of 6–10x. Funding rates act as the primary mechanism balancing long and short positioning, rising when leverage is skewed long and falling when positioning shifts bearish.
sUSDe captures this dynamic directly. The product deploys delta-neutral strategies across BTC and ETH perpetual futures, earning the funding rate basis as yield. On Pendle, sUSDe has achieved significant adoption through yield-stripping markets that allow participants to trade the product’s implied yield into fixed maturities. Historically, 30-70% of the sUSDe supply has been utilized on Pendle.
With multiple maturities trading simultaneously, these markets reveal the market-implied path of yields into the future, forming an observable term structure. This structure reflects expectations for how funding rates and leveraged positioning may evolve.
In this respect, the sUSDe term structure functions analogously to traditional financial curves such as the VIX term structure or treasury yield curves, which are widely used to infer forward distributions of volatility or interest rates.
Backwardation occurs when the term structure slopes downward. The front month implied yield is above the back month, with the market expecting declining funding rates. For an example of backwardation, a snapshot of the term structure on 12/15/24 is provided below, where the front month implied yield was at 29%, while the back month implied yield was at 20.5%, producing a term spread of -8.5%.

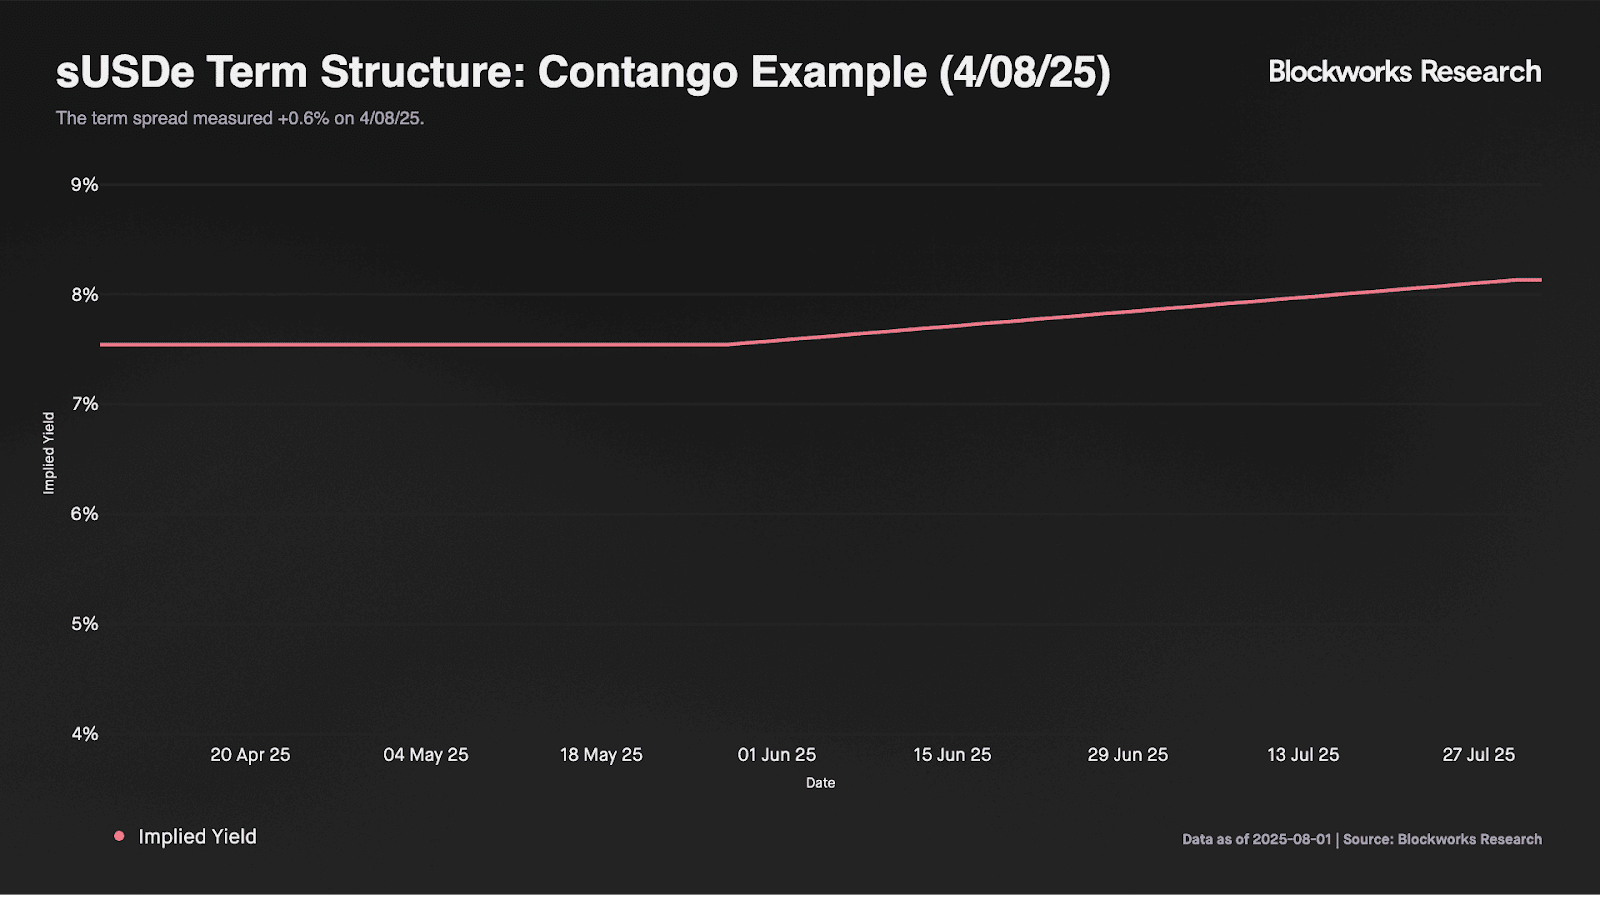
Contango occurs when the term structure is upward sloping. The front month implied yield is beneath the back month, with the market expecting rising funding rates. For an example of contango, a snapshot of the term structure on 4/08/25 is provided below, where the front month implied yield was at 7.55%, while the back month was at 8.13%, producing a term spread of +0.6%.
The sUSDe term structure reveals how the market expects funding rates to move and, in turn, this yield curve can be used to infer how leveraged positioning in BTC and ETH may change in time. Steep backwardation or contango in this yield curve can serve as a valuable indicator for how the carrying cost and price of BTC might shift looking forward.
The Term Spread as a Forward-Looking Indicator
To track changes in the curve over time, we construct the rolling term spread, defined as the difference between back-month and front-month implied yields. Positive values indicate contango, while negative values indicate backwardation.

We then examine the relationship between the term spread and BTC’s forward realized return skew, measured as the difference between the maximum and minimum returns over the subsequent 90–120 days. We assign a percentile rank to each term-spread observation based on its historical distribution and bucket the observations by decile.

The results indicate a clear relationship. Positive term spreads are associated with positive forward return skew, while steeply negative term spreads consistently precede negative skew. These findings suggest that the term spread is most informative at its extremes, rather than near its mean.
The sUSDe term structure on Pendle reveals the market’s expectations channel, offering a forward-looking signal to changes in the cost of carry, price level of BTC, and all metrics downstream of these. The sUSDe term structure remains a relatively new market construct, with a limited historical sample and intermittent gaps when only a single maturity is listed. As such, it should be considered as one input within a broader analytical framework. Historical data supports the hypothesis that the term structure can be used to forecast market regimes, with steep backwardation signalling a bearish outlook while contango is bullish.
You can read the full report for free and check out the corresponding data on our sUSDe term structure dashboard.
— Luke


NYU finance professor Aswath Damodaran describes the S&P 500 as highly-priced but not in obvious bubble territory.
He frames today’s AI rally as a “big market delusion” in which chip “architecture” players have durable economics while most LLM bets are wildly speculative. He walks through his own positioning — selling Nvidia after its massive run but holding Microsoft — then critiques lazy shorthand like simple P/E screens. He argues that investors need to follow actual cash flows, capital return (especially buybacks), and competitive dynamics to understand why equity markets have stayed resilient.
Damodaran warns that while AI should be a clear win for consumers, intensified competition will likely compress margins across many firms, concluding that in a world of eroding trust in institutions, gold functions less as a return-seeking asset and more as an insurance policy.
TN from Pendle went on the 0xResearch podcast to discuss the recent tokenomics upgrade from vePENDLE to sPENDLE, a liquid staking token that removes multi-year locks in favor of a 14-day withdrawal period.
TN highlights the need for a system that better fits Pendle’s current scale and encourages participation from a broader set of investors. The discussion shifts towards Boros, the yield exchange’s target user base, feedback from the market, plans for future growth, and increased leverage across multiple trading venues.

Sam Schubert from Blockworks Research published an article arguing that the market is underpricing Galaxy Digital; this is after ERCOT approved an extra 830 MW at its Helios site, doubling total power capacity to 1.6 GW and implying ~$1.2B/year in unlevered FCF at full ramp.
On Schubert’s updated sum-of-the-parts valuation, Helios alone is worth ~$40/share in present value and ~$80/share at full build, versus GLXY’s ~$32 current price, before adding Galaxy’s Digital Assets and tokenization businesses, which benefit from CLARITY and OCC tailwinds.
He sees execution at Helios, tenant concentration (CoreWeave), and a “conglomerate discount” as real risks, but still views GLXY’s risk/reward as attractive.