- 0xResearch
- Posts
- Is Hyperliquid hyper liquid?
Is Hyperliquid hyper liquid?
S&P 500 touches 7K, gold up, BTC flat
Boccaccio & Shaunda Devens
January 29, 2026

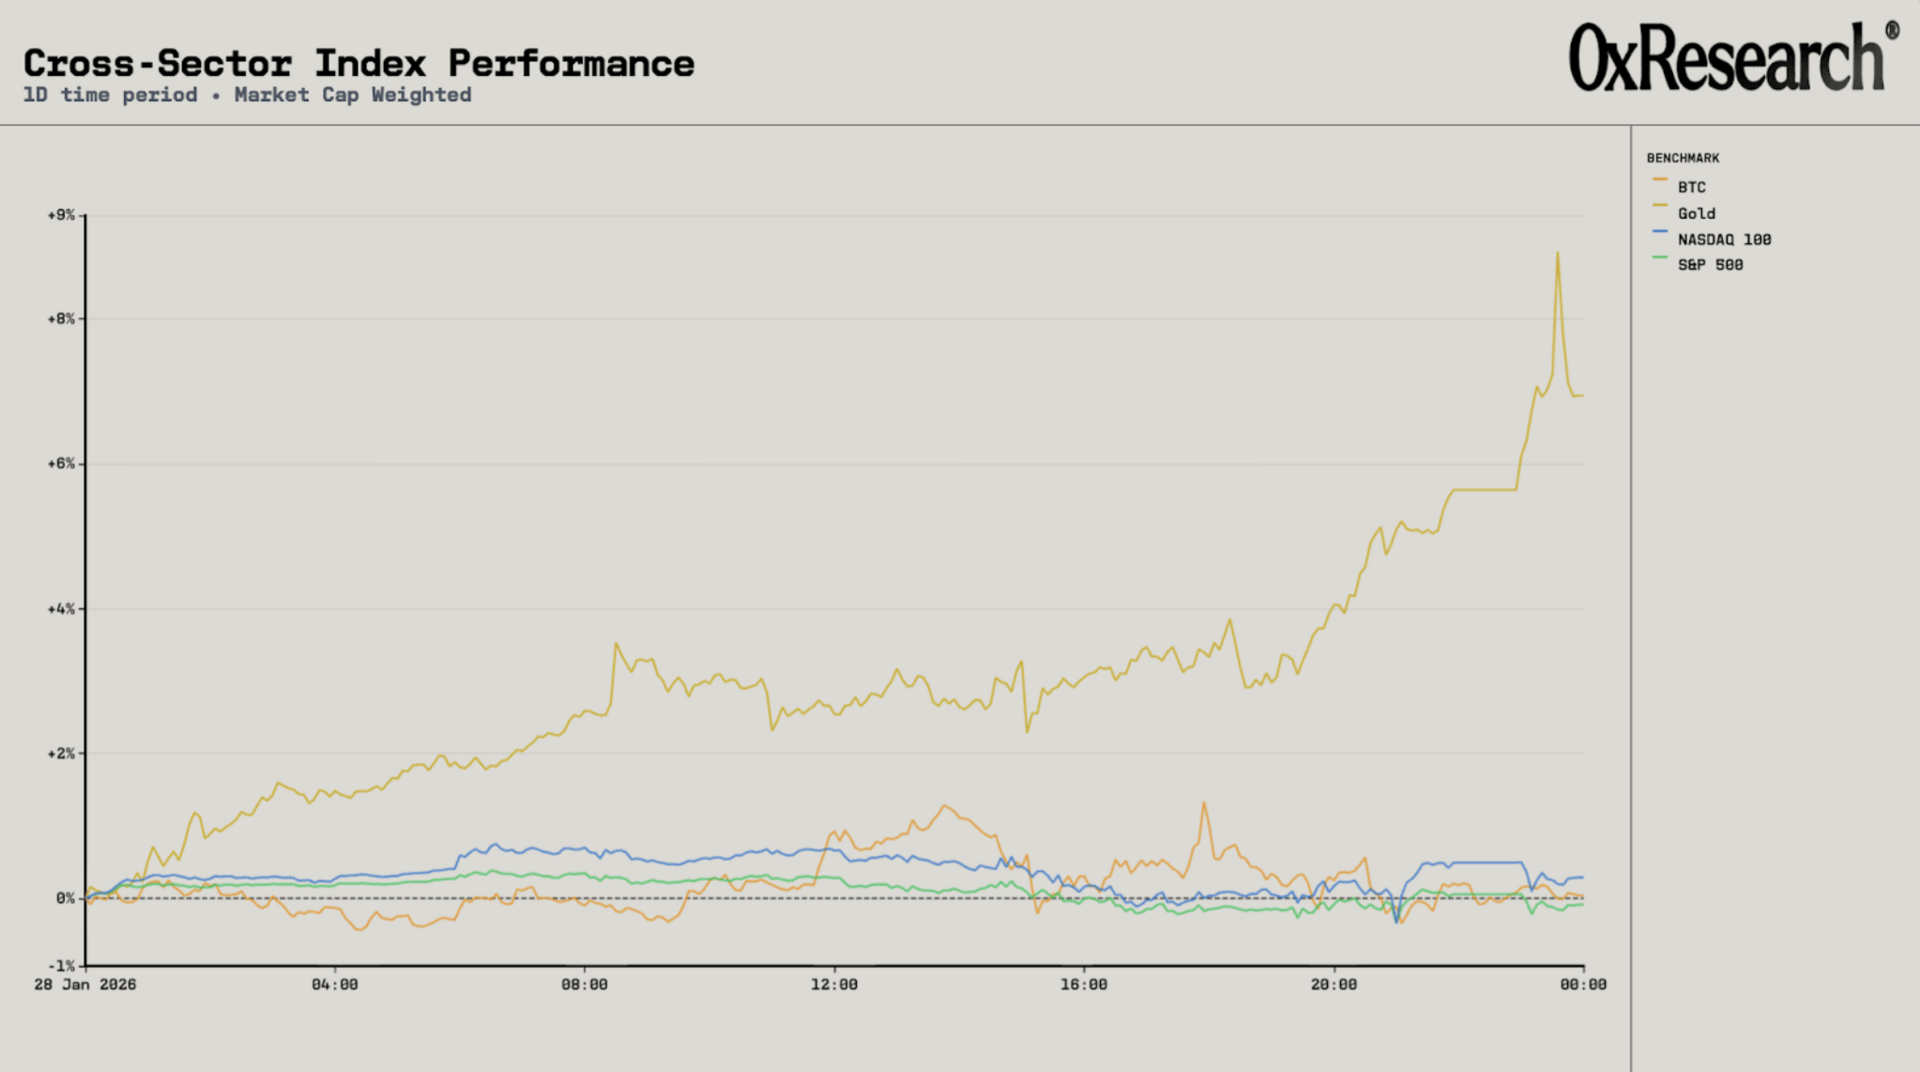
Markets reached a milestone this week as the S&P 500 briefly touched 7,000 for the first time, though the real story was gold’s dramatic 6.94% surge past $5,500 amid dollar weakness and geopolitical jitters.
We also take a data-driven look at whether Hyperliquid lives up to its claim of being crypto’s most liquid venue, and explore what ERC 8004 could mean for AI agent infrastructure.

The S&P 500 briefly touched 7,000 for the first time on Tuesday before pulling back, ending yesterday’s session marginally lower at -0.09%. The milestone came as markets recovered from last week’s Greenland-related selloff, with attention on earnings season. The NASDAQ 100 edged up 0.29%, supported by tech gains. Bitcoin was essentially flat at +0.04%.
Four major companies reported earnings after the bell on Wednesday, with three posting beats.
Microsoft reported EPS of $5.16, comfortably ahead of the $3.85 consensus, driven by strong cloud and AI performance.
Meta came in at $8.88 versus expectations of $8.23, with shares jumping around 10% in after-hours trading on the back of strong ad revenue and guidance for $115-135 billion in AI-related capital expenditure for 2026.
Tesla beat with non-GAAP EPS of $0.50, against estimates of $0.45, and announced it would wind down Model S and Model X production to make way for Optimus robot manufacturing at the Fremont line.
ASML, which had lifted chip stocks earlier in the week with its AI-driven sales guidance, reported $7.30 versus the $9.01 consensus.
Apple is due to report today.
Gold was the standout performer, surging 6.94% to break through $5,500 per troy ounce. The rally was driven by a weakening dollar, geopolitical concerns around US policy, and growing investor unease with traditional haven assets like government bonds. Tether, which holds about 116 tonnes of gold, saw its bullion holdings gain over $5 billion in value, to a total worth of approximately $24 billion.
The dollar fell to its lowest level in four years, down 2.6% since the start of 2026, after Trump said he was “not concerned” by its decline. Despite the outperformance of gold and the underperformance of the dollar, Bitcoin has failed to see meaningful price action or ETF inflows.

Is HyperLiquid hyper liquid?
On Jan. 26, 2026, Jeff Yan, co-founder of Hyperliquid, claimed the protocol had become “the most liquid venue for crypto price discovery in the world.” The claim was supported by a side-by-side BTC order book snapshot showing 148 BTC across the top five bid levels on Hyperliquid versus 82 BTC on Binance.
Jeff also argued that HIP-3 had transformed Hyperliquid into the most liquid venue for perpetuals tied to traditional financial assets, citing open interest of $790 million, up roughly 3x over the prior month.

To evaluate claims around Hyperliquid’s liquidity, we built a real-time data collection system capturing full order book snapshots every 500 milliseconds and every executed trade across Binance, Hyperliquid, Bybit and HIP-3 markets. For each snapshot, we measured resting depth at different basis points from mid-price, and paired this with trade-level data to study execution outcomes.

At the top of the book, Hyperliquid does show deeper displayed liquidity on BTC. At ±1 bps from mid, Hyperliquid averages roughly $3 million of resting depth versus Binance’s $2.1 million. At ±2 bps, Hyperliquid shows $5.8 million compared to Binance’s $4.1 million. Framed this way, Hyperliquid consistently posts more size close to mid.
Looking at the full distribution rather than point estimates reinforces this result. The cumulative distribution function of ±1 bps depth shows Hyperliquid’s curve shifted to the right of Binance for most of the range. Median ±1 bps depth is $2.40 million on Hyperliquid versus $1.91 million on Binance, and across the full sample, Hyperliquid has deeper ±1 bps depth in roughly 67% of observed intervals.


However, quoted depth is not synonymous with executable liquidity.
Hyperliquid’s own documentation states that, within each block, order-book transactions are ordered such that cancellations are processed before IOC and GTC submissions. This design mechanically reduces adverse selection risk for makers, but it also increases the probability that displayed depth can disappear before being hit.
In contrast, Binance operates a standard price-time priority central-limit order book, where passive liquidity faces meaningful pick-off risk and displayed size tends to be firmer as a result.
More broadly, liquidity is multi-dimensional: Depth, spread, and resilience all matter, and fast cancellation can inflate apparent depth without improving execution.
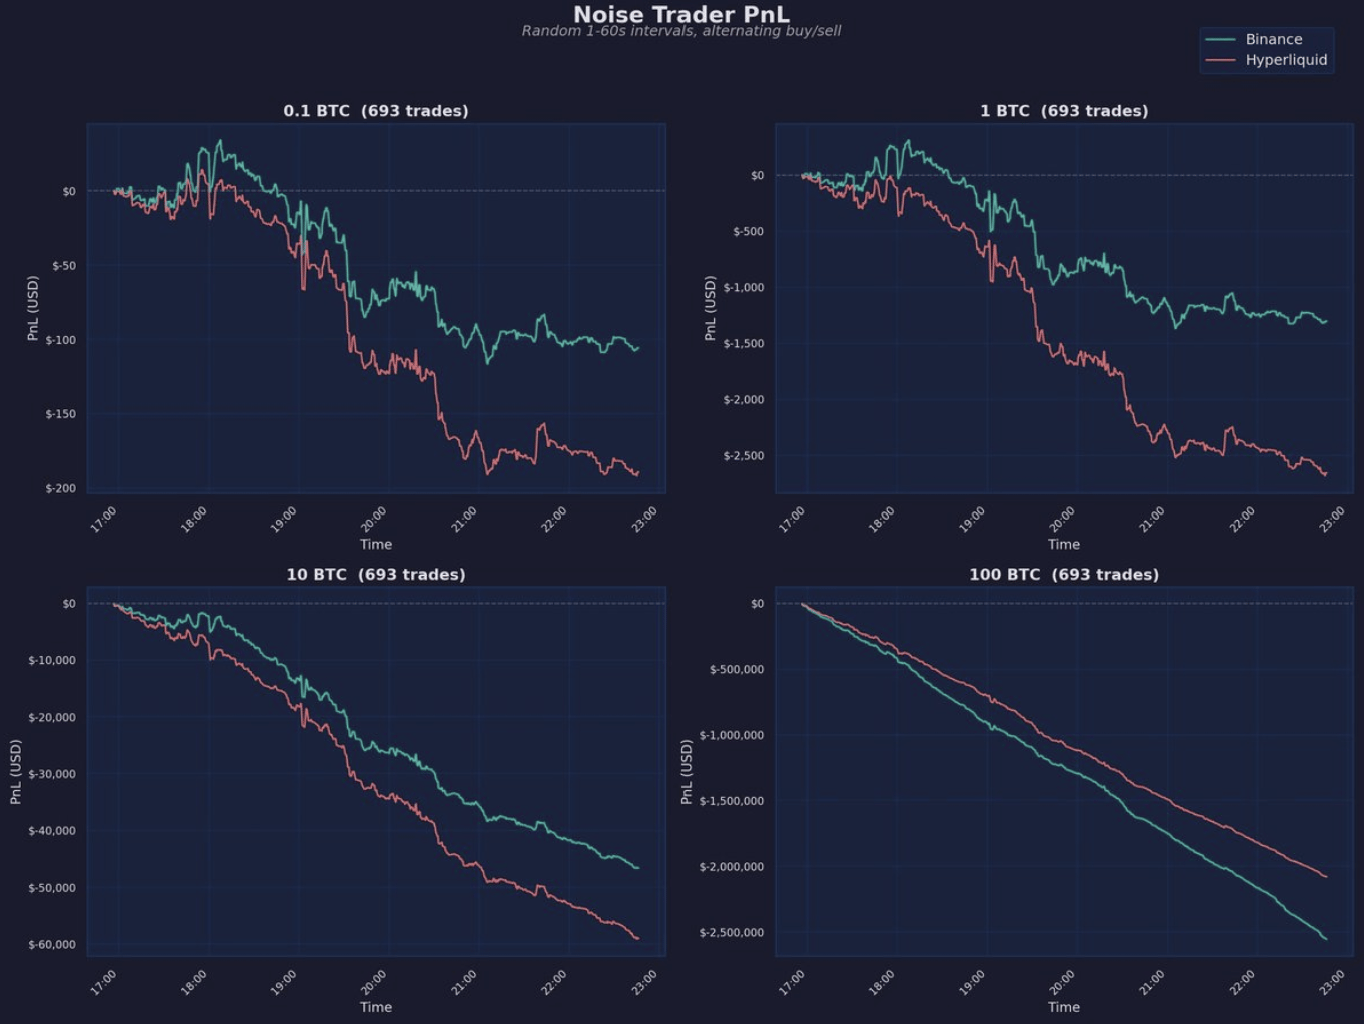
To translate depth into execution outcomes, we reference a third-party “noise trader” simulation (h/t Yenwood). The models place buy/sell orders at random intervals. The chart’s implication is that Binance’s tighter spreads tend to win at small sizes, while Hyperliquid’s deeper book can offset wider spreads at larger sizes, with a crossover only at sufficiently large notional.
Overall, this paints a more nuanced picture of Hyperliquid versus Binance. Both venues look strong, but execution quality is harder to monitor than a depth screenshot suggests. In the coming weeks, we’ll publish a deeper market microstructure analysis comparing execution, resiliency, and cancellation dynamics across both exchanges.
— Shaunda
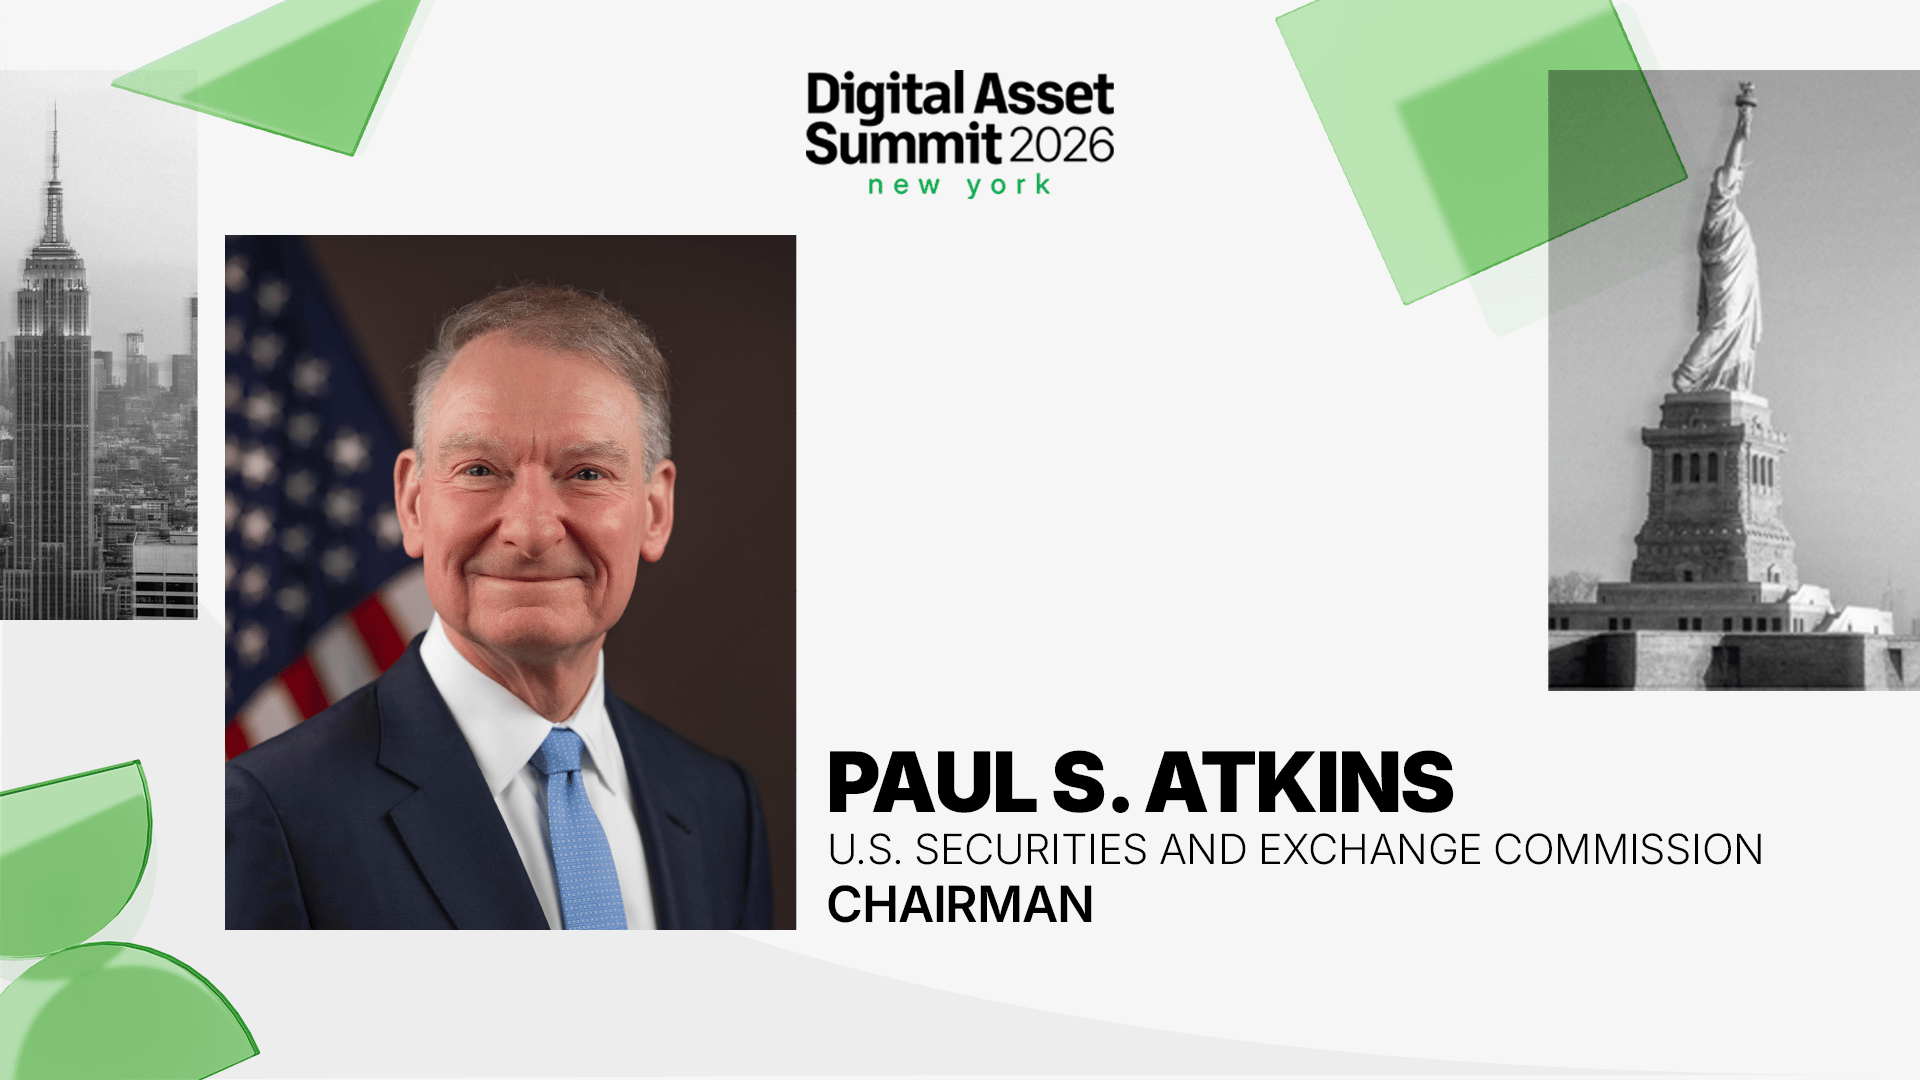
Crypto’s premier institutional conference is back this March 24–26 in NYC.
Don’t miss SEC Chairman Paul S. Atkins’ keynote on Day 1.


As agents begin handling capital and coordinating autonomously, trust becomes the key constraint to broader adoption.
ERC 8004 introduces a new trust layer for AI agents by standardizing onchain identity, reputation and validation. The rollout mirrors the early x402 narrative, in which adoption lagged the initial launch until major integrations and a viral use case pulled attention into the ecosystem.
If ERC 8004 follows a similar path, downstream infrastructure tied to the standard could see outsized benefit as the narrative gains traction.

Legion published an article analyzing Polymarket's token sale prediction markets, examining 231 markets across 29 token sale events.
The analysis found that while Polymarket claims high accuracy rates, real predictive accuracy one week before market close was only 66.7%. The study revealed systematic overoptimism among participants, with wrong predictions consistently overestimating valuations.
Key findings include that high prediction market volume serves as a contrarian signal, with tokens attracting the most betting activity (like Monad at $89 million) and showing the highest overoptimism. The article concludes that these markets function better as sentiment indicators than forecasting tools.